
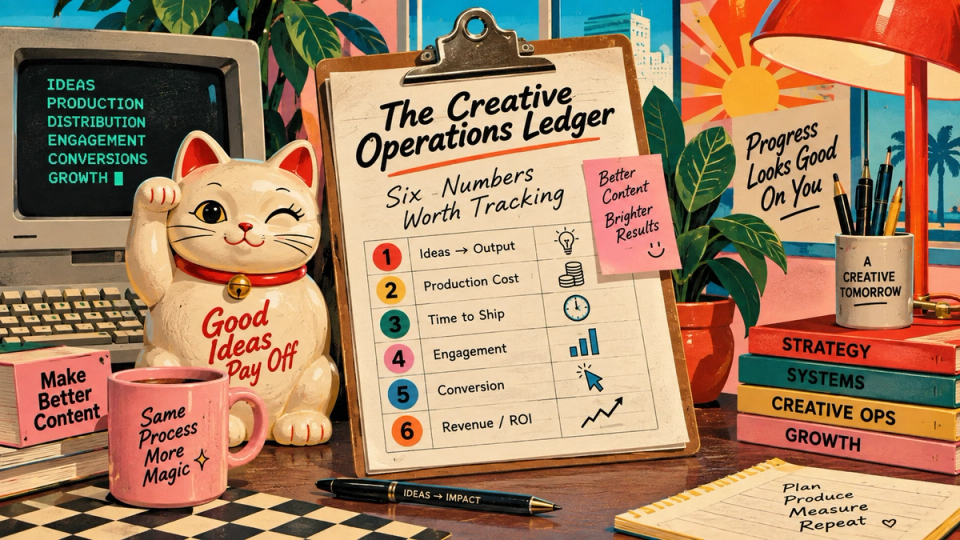
Ask a content team how it is doing and you get a volume number: assets produced, posts published, videos shipped. Volume is an input. It tells you how much was spent and nothing about whether the operation is getting better at spending it, which is the only question an operations metric should answer.
The six
| METRIC | DEFINITION | WHAT IT REVEALS | COLLECTION COST |
|---|---|---|---|
| Cost per accepted asset | Total spend divided by assets that shipped | The real unit economics, including everything rejected | Low, if the run log exists |
| Acceptance rate | Shipped divided by produced, per asset type | Whether the process is aimed correctly. The leading indicator. | Low |
| Cycle time | Brief received to asset live | Where the queue is. Usually not where anyone thinks. | Low, from two timestamps |
| Rework rate | Proportion of assets returned after being marked done | Whether the brief or the gate is failing. The other leading indicator. | Medium: needs a status people remember to set |
| Reuse rate | Proportion of output derived from existing assets | Whether the library is an asset or a graveyard | Medium |
| Time to first draft | Brief received to something reviewable | How long the team spends before anyone can react | Low |
Why acceptance rate and rework rate lead
Acceptance rate answers whether the work is aimed at the right thing. A low rate means the brief, the reference or the gate is wrong, and every downstream number inherits that. Fixing it improves cost per accepted asset, cycle time and time-to-first-draft simultaneously, because all three are partly measures of wasted attempts.
Rework rate answers whether "done" means anything. A team with fifteen per cent rework has a definition problem: either the brief was ambiguous or the review happened at the wrong point. Rework is the most expensive kind of work because it is paid for twice and morale is charged for it as well.
Instrumenting without buying anything
Every one of the six can be derived from two things most teams already generate: a run log and a status field. The failure is not tooling, it is that neither is filled in consistently.
- Make the log automatic. Anything a person has to remember to write down will be written down for three weeks.
- Use four statuses: briefed, in production, in review, live. Add one for returned-after-done and you have rework for free.
- Encode the asset type in the filename. Segmentation becomes a text filter.
- Timestamp two events only: brief received and asset live. Everything else about cycle time can be derived later.
- Review the six monthly, in one page, with a note against anything that moved. Data nobody looks at is a cost with no benefit.
The numbers not to track
- Assets produced. An input dressed as an outcome.
- Utilisation. A team at a hundred per cent utilisation has no capacity to react, which is a fragility.
- Average anything, unsegmented. Averages across asset types are the single commonest way an operational dashboard misleads.
- Cost per generation. Excludes the rejected work, which is where the cost is.
- Anything nobody has agreed an action for. If a number moving would not change what anybody does, it is decoration.
What to do when a number moves
Agree the response in advance, once, and write it down. Acceptance rate falls: audit the last ten briefs against the ten before. Rework rises: move the review earlier, before production starts. Cycle time rises with steady volume: find the queue, which is usually approval and rarely production. Reuse falls: the library has a findability problem.
Agreeing the response before the number moves is what stops a monthly review becoming a meeting where everybody explains why the number is not their fault.
The number that converts a per-generation price into something you can plan with.
COST PER ACCEPTED ASSET, DEFINED →